Start with your report.
Your existing report, representative data and main questions become a defined scope and set of KPIs.
EXCEL TO POWER BI · REPORT AUTOMATION
MetricVale turns one recurring Excel report into a Power BI report for UK small businesses. We check the totals against your source files and show your team how to refresh it.

| Day | Workload | Completed |
|---|---|---|
| Mon | 95 | 76 |
| Tue | 104 | 91 |
| Wed | 106 | 83 |
| Thu | 112 | 97 |
| Fri | 99 | 81 |
The data you already have.
Copy the latest files
Clean the same columns
Recalculate the KPIs
Rebuild the report
Four manual steps. Every reporting cycle.
The answer is useful. The routine repeats.
Illustrative workflow and synthetic data. Actual refresh depends on your source environment.
Showing manual reportingThe copying, cleaning and checking are familiar. They take time every week or month, even when the questions have barely changed.
We build one reporting model around your agreed sources and KPIs, so the next cycle follows a defined routine. Start with the report your team keeps rebuilding.
REPORTING DEMO / FICTIONAL DATA
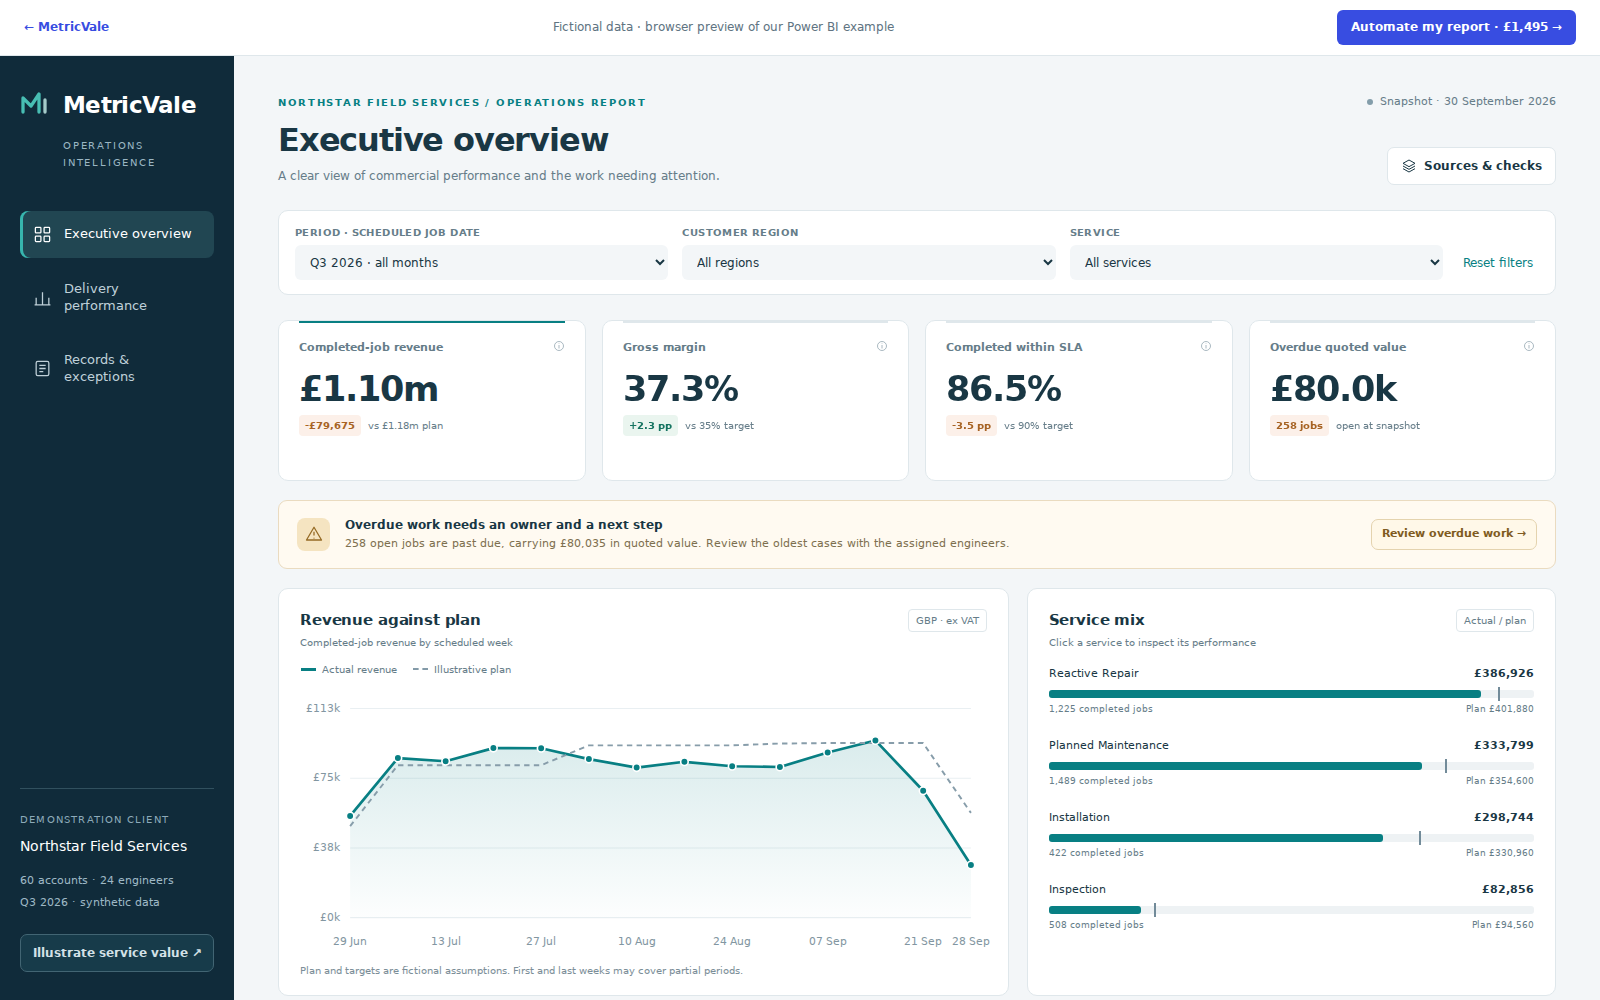
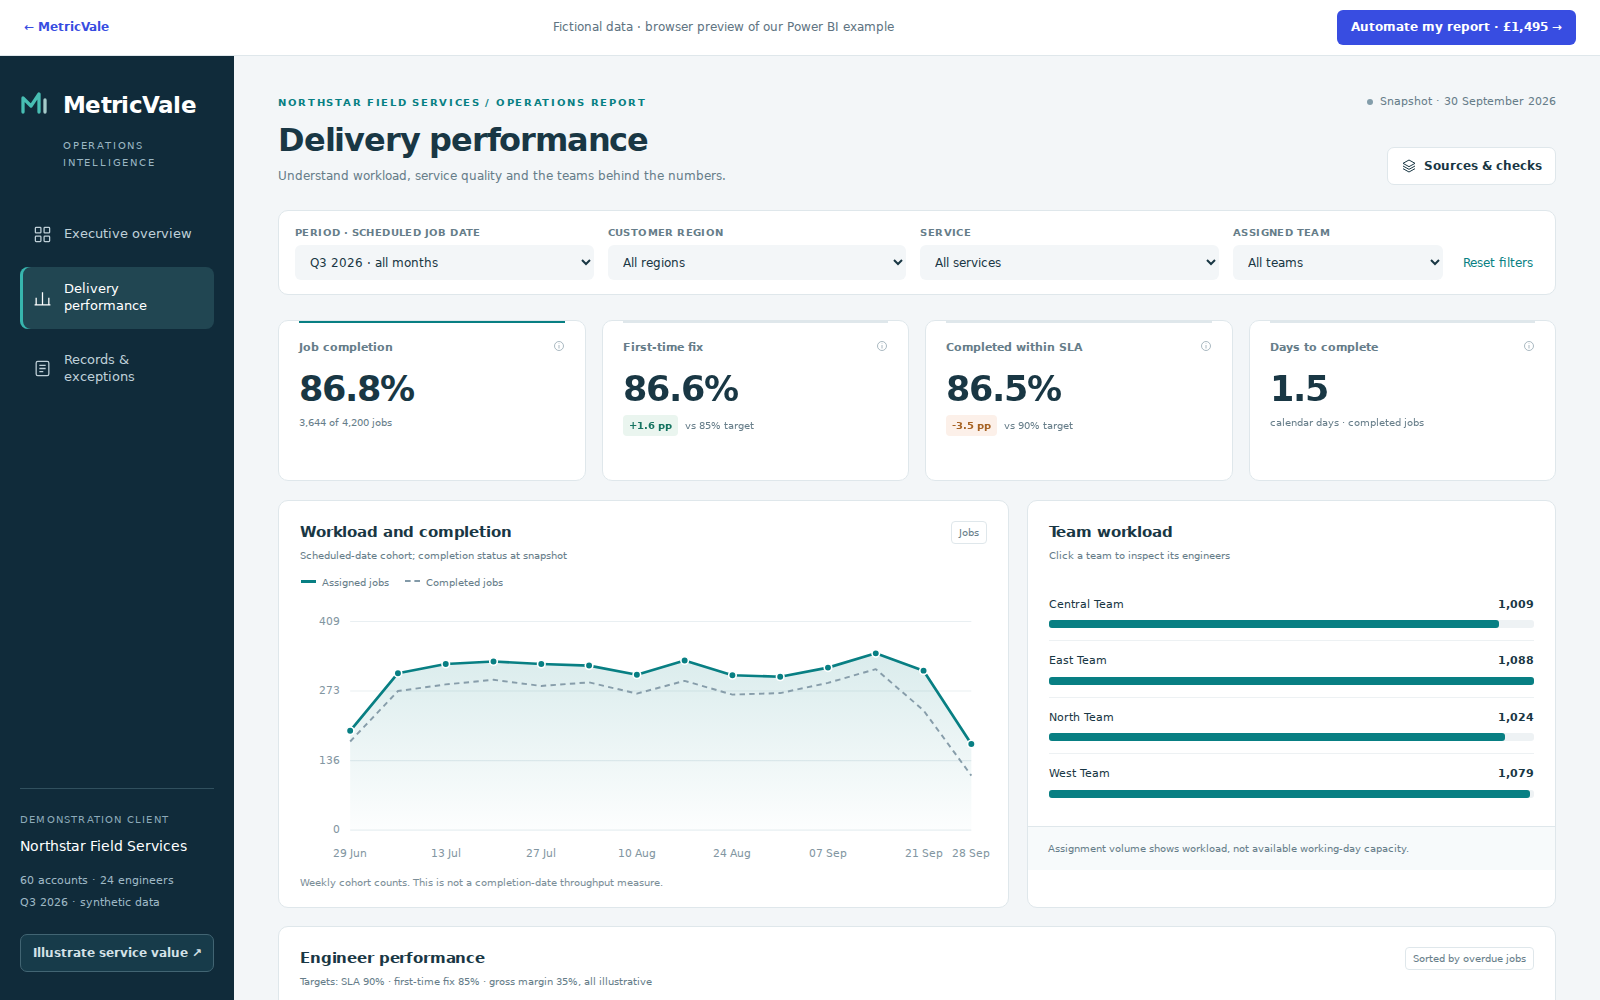
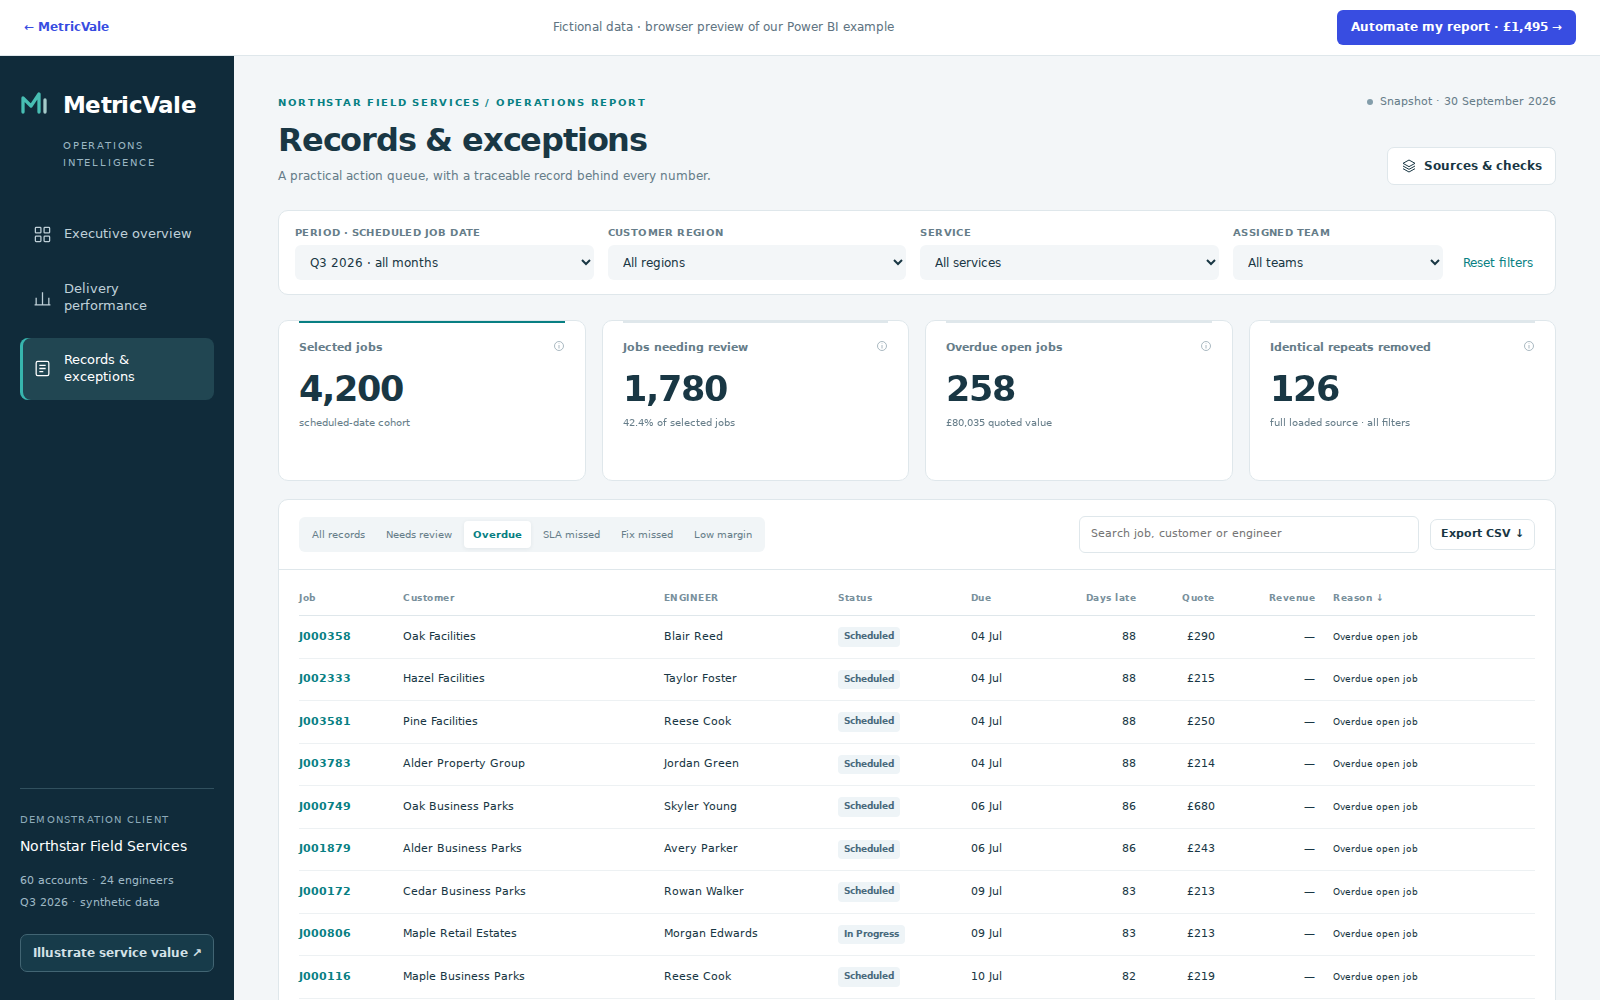
Explore Northstar Field Services, a fictional business with 4,200 jobs. See revenue against an illustrative plan, service-target gaps and the overdue work needing attention.
The example combines a jobs export with a reference workbook. Source checks reconcile 4,326 received rows to 4,200 unique jobs after removing 126 identical repeats.
This is an interactive browser preview of the example reporting model. All businesses, records, quotes and targets are fictional. Client reports are delivered in Power BI.
A 75-SECOND WALKTHROUGH
Up to three structured sources, three Power BI pages and around ten agreed core KPIs. Scope and delivery plan are confirmed before work starts; Microsoft licences are separate.
50% to start. 50% on completion.
Scope and delivery plan agreed first.
Up to three files or tables. One recurring reporting process.
Management, operational or commercial views, shaped around the questions you need to answer.
Defined once and reconciled back to the source before handover.
Planned delivery from an agreed start, with representative data and access in place.
Power Query + data model + DAX · Scheduled refresh where supported · One revision · 45-minute handover · One-page runbook · 14-day defect fixes
Read the full Excel to Power BI service scope and refresh requirements
Outside this packageReal-time reporting and API or ERP integrations are outside this package. Microsoft licences are separate.
APIs, ERP integrations, Fabric or data warehouses, real-time reporting, large migrations, complex row-level security, embedded portals, custom software and source-system repairs are outside this package. Microsoft licences are separate.
The report is the visible part. The model, reconciliation and runbook make it repeatable.
Your existing report, representative data and main questions become a defined scope and set of KPIs.
Power Query prepares the sources. The reporting model and DAX measures turn them into consistent answers.
Match the results back to the source, review the report together and include one revision.
A 45-minute walkthrough and one-page runbook, followed by a 14-day defect-fix period.
We confirm source access, licence requirements and refresh support before the build. Feedback or access delays can affect the planned delivery date.
Answer four questions about your recurring report. Review the initial scope guidance for the £1,495 package, then send us an enquiry email.
Prefer to email directly? hello@metricvale.co.uk
This check runs in your browser. Nothing is sent automatically and no source data is uploaded.
Open the email draft, add a little context about your report, then press Send in your email app. Keep confidential data out of the initial email.
Copy the draft below and paste it into your preferred email service. Send it to hello@metricvale.co.uk with the subject MetricVale project enquiry.
Use “Copy enquiry”, or select and copy the text yourself. Add context about your report, review the draft and press Send in your email service.
Nothing is sent automatically. If your email app doesn’t open, use “Copy enquiry” or save your brief, then send it from your preferred email service.
Scope, refresh, licences and what happens next.
Report automation replaces repeated copying, cleaning and calculating with a reusable data preparation process and reporting model. We use Power Query and Power BI to turn one recurring Excel-based report into a repeatable process.
Our One-Report Automation package has a fixed project fee of £1,495. It covers one reporting process, up to three structured source files or tables, up to three report pages and around ten core KPIs. We confirm the scope before work starts. Payment is 50% to start and 50% on completion.
Scheduled refresh is included where your source environment supports it. We check the source location, credentials, licences and any gateway requirements before agreeing the scope. Automation still depends on source files being available and updated consistently.
The planned delivery window is ten working days, with scope, representative source data and access agreed before work starts. We confirm the start date and delivery plan together. Client feedback or access delays can affect the schedule.
Your current report, a representative source file, your main reporting questions and KPI definitions. Start with anonymised samples; agree a suitable transfer method before sharing business data. You don’t need to upload anything to use the fit check.
Your publishing, sharing and refresh requirements determine the licences needed. We check these during scoping; Microsoft licences are separate from the reporting build. See Microsoft’s report-sharing guidance for the current requirements.
The package includes a 45-minute handover, a one-page runbook and a 14-day defect-fix period after delivery. New sources, extra report pages, ongoing maintenance and changes to the agreed requirements need a separate scope.